HOME…..MATRIX…..METHODOLOGY
FXliquidity
Understand liquidity profiles under stressed market conditions (COVID-19)
Observe major shifts in liquidity profiles between normal and stressed (COVID-19) market conditions for different currency pairs. All chart analysis is delivered utilising Mosaic Smart Data’s Natural Language Generation (NLG) technology. Before reading this analysis please read our disclaimer.
FXLIQUIDITY MATRIX
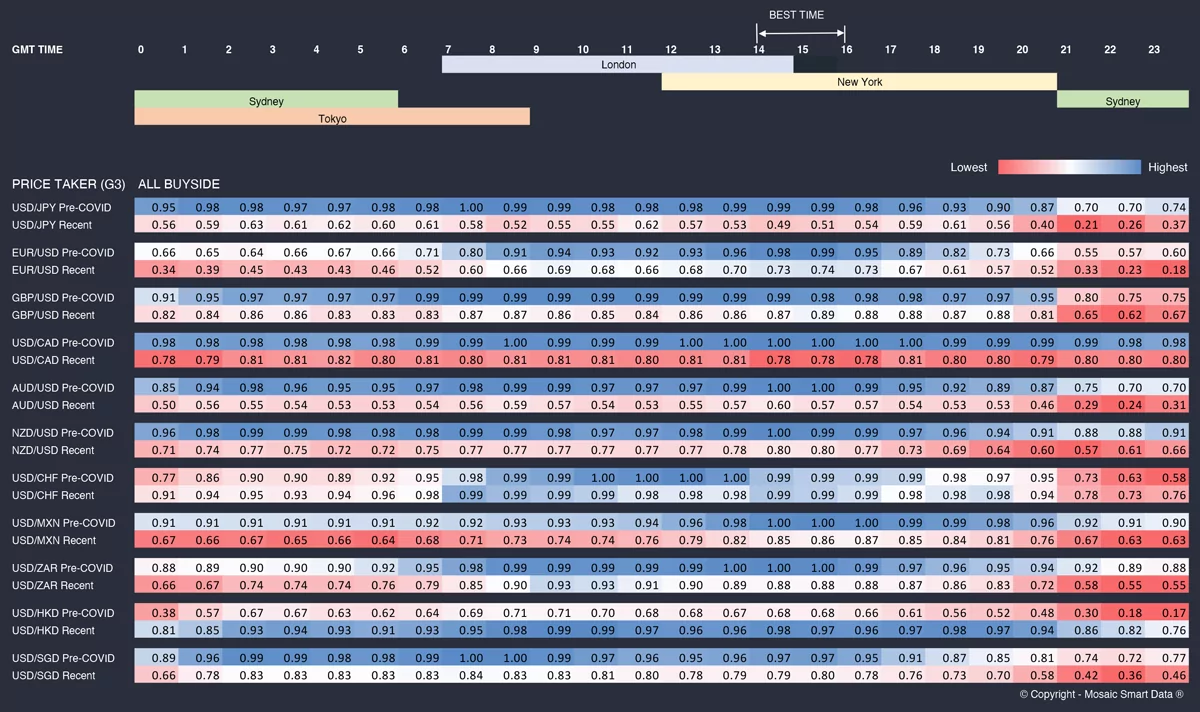
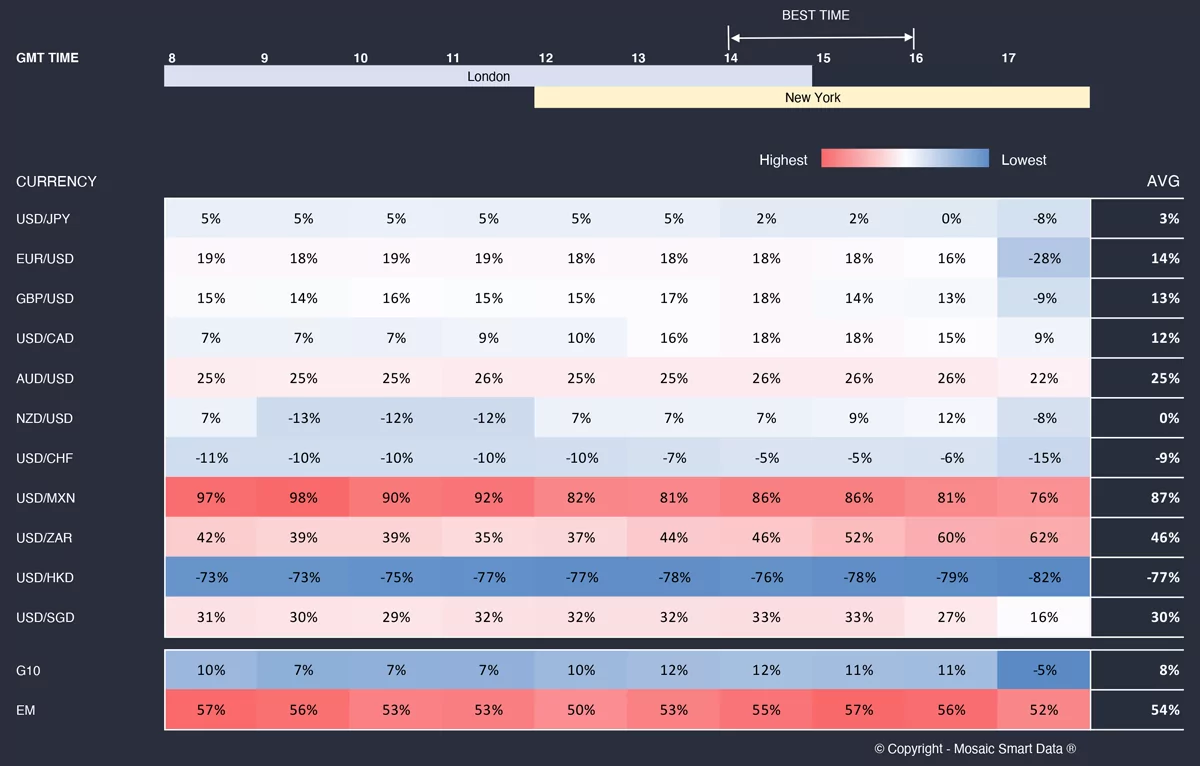
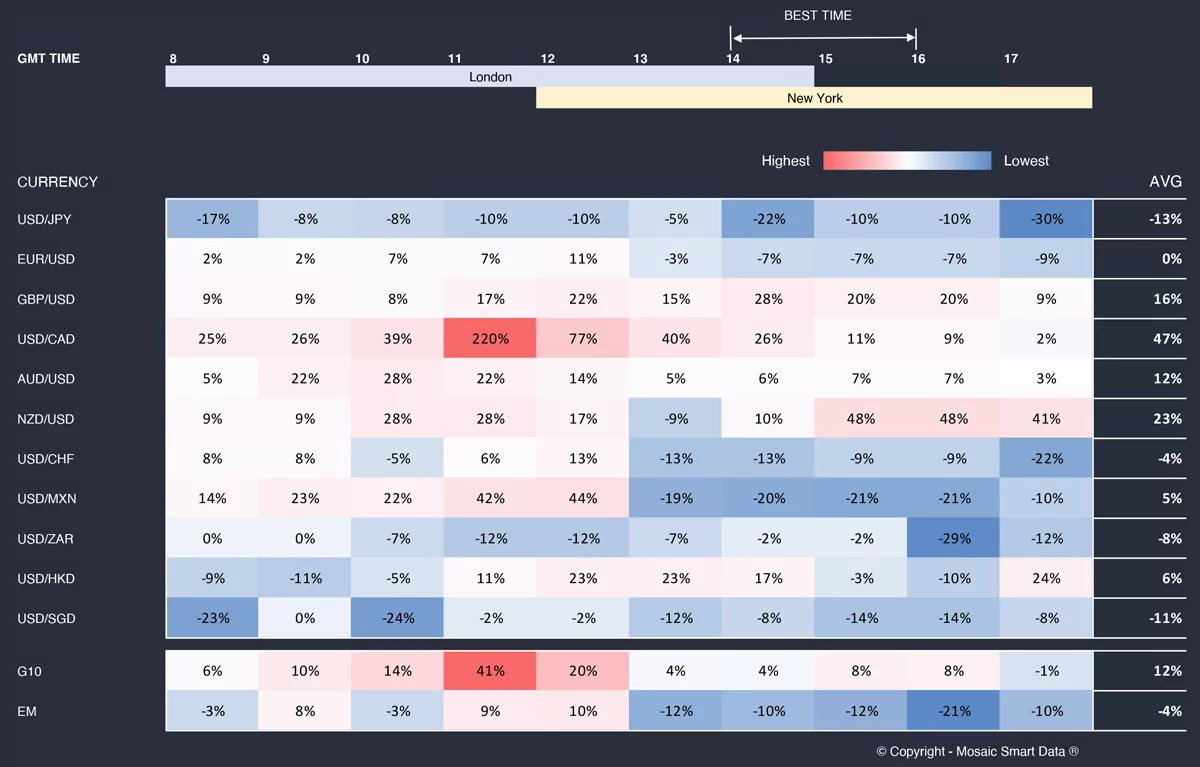
PRE-COVID: 1st June 2019 – 20th February 2020
RECENT: 13th October – 3rd November
This matrix shows the liquidity scores for various currency pairs for the periods, pre-COVID and recent. The scores are scaled between 0 and 1, with higher liquidity scores being better.
Spread Elevation Matrix
Spread elevation: Shows the % change in the spread levels between the recent period and the pre-covid period.
Volume Elevation Matrix
Volume elevation: Shows the % change in volume settled at different hourly buckets between recent period and pre-covid period.


