Steps Ahead
Data analytics ROI: the key to levelling up your FICC business
ROI is a true barometer of the value and success a business ultimately derives from the investment they make in a certain piece of technology.
By Matthew Hodgson, CEO, Mosaic Smart Data
In our last paper we discussed why one of the most difficult decisions for a bank considering a new software solution is whether it should build the solution using in-house IT resources or buy market-ready products.
In an ideal world, banks would base decisions on the key criteria of cost, efficiency and productivity, delivered through the lens of specialised capital markets expertise. Central to each of these considerations is ROI – a true barometer of the value and success a business ultimately derives from the investment they make in a certain piece of technology.
When it comes to data analytics software, banks tend to measure ROI by looking at client interactions and execution – in other words, how their traders and salespeople have been able to harness the new information at their disposal to make more calls to clients, spend more time on each call, and execute more business. These client relationships are the backbone of any FICC business, and levelling up call volumes and times typically results in levelling up a bank’s bottom line and market share.
Many banks today struggle to provide their traders with real-time pricing information, and salespeople often have delayed access to data and rely on spreadsheets that can take as much as 80% of their time to generate and populate. So, against this backdrop, how does data analytics deliver business value and immediate ROI?
Driving revenue
A platform like Mosaic enables a bank to understand and measure the variables driving its business objectives. Understanding this allows a high-level goal to be broken down into specific, measurable and actionable targets with a foundational building block being market share:
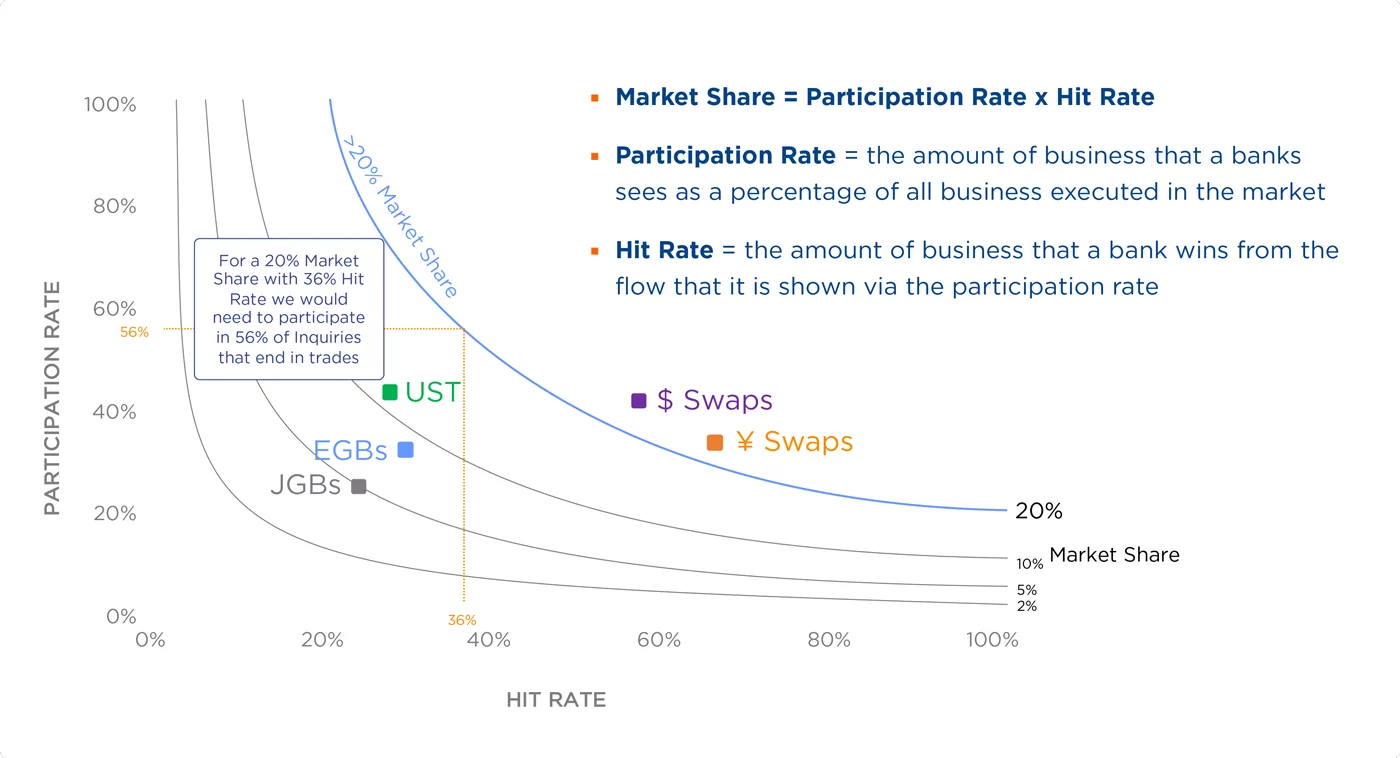
Market Share = [Participation Rate] x [Hit Rate]
This simple chart below highlights the relationship between the two variables underpinning market share, namely ‘participation rate’ (the amount of business that a bank sees as a percentage of all business executed in the market) and ‘hit rate’ (the amount of business that a bank wins from the flow that it is shown via the participation rate). Applying these principles within a sales and trading team allows improvement to be delivered on both fronts. Namely, client facing sales teams are responsible for bringing a higher and improving participation rate (Y-axis) from the client base that they cover, and trading teams are responsible for executing that flow (X-axis):
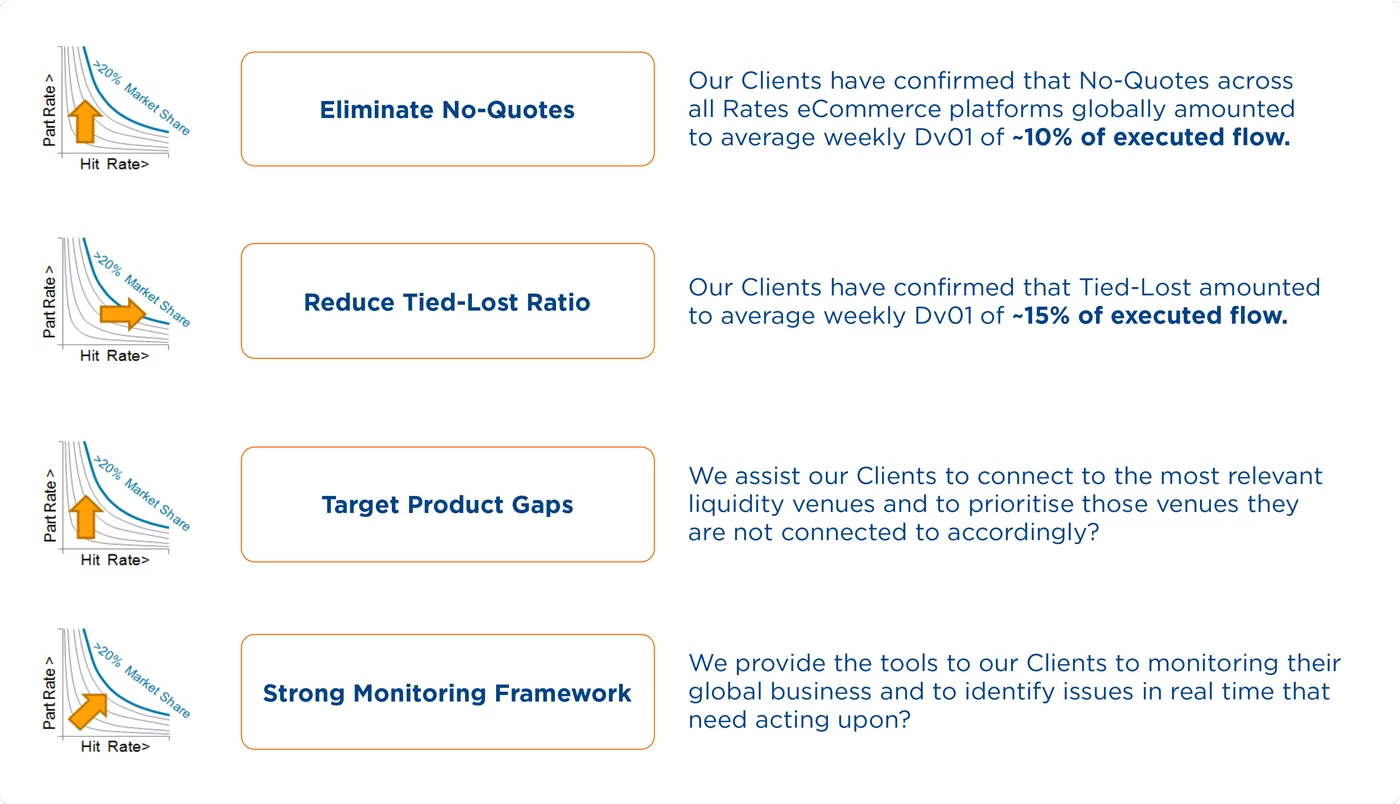
Mosaic enables banks to focus on improving the variables with the biggest impact. But what does this mean? The graphic below breaks down these variables and why they matter.
“…marginal changes…when multiplied by a huge number of instances, or allowed to work over a long time, produce a significant effect.”
According to Shumpeter – Little things that mean a lot
Retain more profit
The compounding impact of small improvements to the variables above is best illustrated by examining a single asset class trading on a single ECN (Electronic Communication Network). Below, we have selected US Treasury trading through a market leading ECN and have made a conservative estimate of annual volumes based on historical data. We have then selected participation, hit rate and spread numbers representative of a typical bank. Together, these provide an estimate of the baseline performance of the Mosaic platform – but you can replace these with real numbers from your own business to model your potential opportunity.
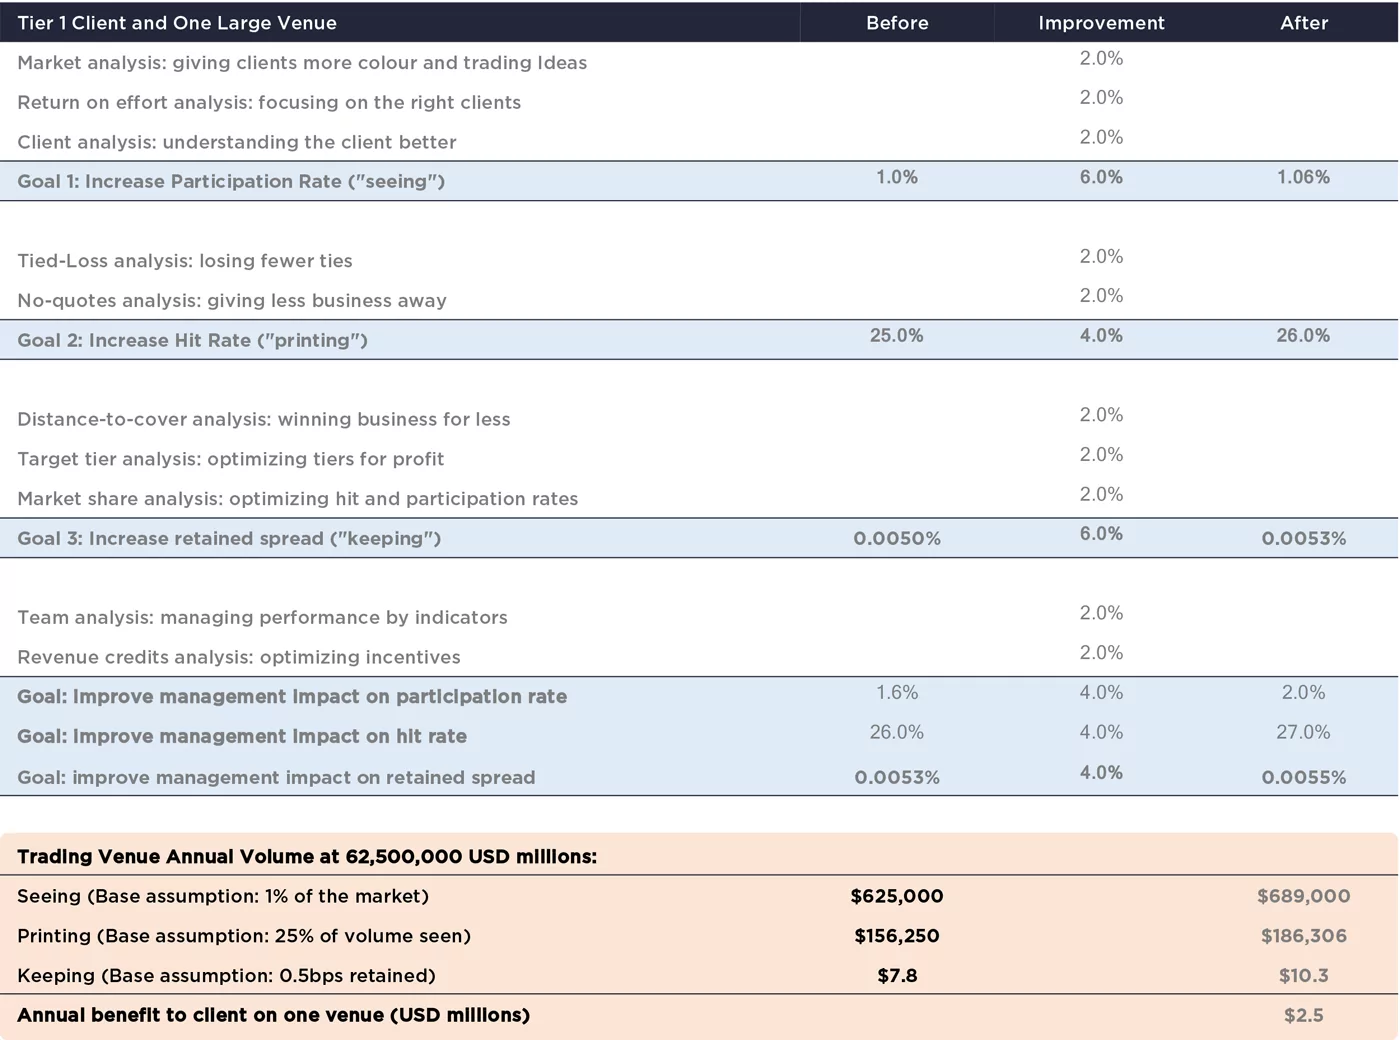
In the table below, we have applied the improvements we believe would be readily attainable given the correct senior management buy-in, tools and focus. We have assumed marginal improvements of 2% on each input variable identified.
For sales and trading front line teams, our first goal is to increase our participation rate, the amount of business we see. Baselining our starting point and assuming we see 1% of the total flow in the market, we have applied 2% improvements to the impact of each of:
- Giving clients more market colour and trading ideas
- Focusing on the right clients at the most appropriate time
- Understanding the client better and providing a more tailored service
This overall 6% improvement increases our participation rate to 1.06%.
If our second goal (above) is to increase the amount of business that we print, we have assumed a baseline of a 25% hit rate. With analytics that are designed specifically for market participants, we have again applied a 2% improvement to each of:
- Losing fewer ties in competition (commonly referred to as our tied-lost ratio)
- Giving less business away by ensuring we understand how much business we are not quoting that we have been included in (commonly referred to as no-quotes)
This combined improvement of 4% pushes up our hit rate to 26%.
If our third goal is to increase the amount of margin that we are able to retain on each trade, we have assumed our baseline to capture 0.5bp on average. Most importantly, by understanding the microstructure of all transactions, we can now enjoy micro improvements given we have (new) visibility on essential metrics. We again have assumed small improvements of 2% on each of:
- Distance to cover analysis – being able to widen our bid-offer spread and still print the business given that we know what our next best competitor is pricing at and being able to do this in real time
- Being able to tier clients correctly given we have visibility on the market impact of their business
- Having insight on the client’s sensitivity to price changes, commonly referred to as elasticity and optimising hit rates for specific market share objectives
This new visibility and micro-improvement has the potential impact of allowing the baseline spread captured to increase by 6% from 0.5bp to 0.53bp.
For management overseeing sales and trading front line teams and who also have senior client coverage responsibility (which is the case across the firms we work with), the impact that they have has meaningful pay-off and we assume marginal uplifts of 2% on each of:
- Managing sales and trading team performance by KPI indicators
- Optimising sales credit incentives and having one system to see all business KPIs and sales metrics
We also see the impact that management teams have on improving participation rates, hit rates and retained margin and here we have assumed a 4% uplift on each. We therefore see the compounding impact of management oversight and influence of front-line teams driving participation rates to 1.1%, hit rates to 27% and retained margin to 0.55bp.
Quickly we can calculate the improvement in the bottom line and in the table above the uplift in business seen and printed translates to retained spread improving from $7.8mm to $10.3mm, an uplift of $2.5mm.
The power of applying real time transaction analytics across every asset class and on every trading venue quickly scales into the $10s of millions of additional profit. With this change in approach to client coverage and margin retention, this upward trajectory can be maintained and gown with a data analytics ‘first’ organisational philosophy.
The Route to Optimisation isn’t Straight
In summary, to answer our original question – how does data analytics deliver business value?
In the current market environment, many banks’ FICC businesses need significant re-engineering to retain a competitive edge. The traditional sales function at investment banks is simply no longer fit for purpose, but cultural stasis is the gorilla in the room when it comes to improving productivity.
Looking further ahead, making the right changes today can deliver significant long-term returns. Smart data and smart analytics can certainly be used to achieve a profitable improvement to productivity in the immediate term, but equally importantly they can also serve to future-proof the business.
Mosaic Smart Data offers an award-winning solution, designed specifically for capital markets, by a team with deep domain expertise and years of experience. The product is in daily use by hundreds of people at leading global investment banks and is setting a new category defining standard across the industry by maximising our clients’ ROI. Following a recent pilot with Mosaic, a tier 1 bank reported a 20% increase in call volumes, 22% increase in call duration, 18% increase in inquiries – and 100% of its users wanted to move to production immediately given the tangible benefits enjoyed.
Those firms who make optimal use of analytics today will also be able to anticipate and prepare for change far more efficiently and profitably in the future. Herein lies the key to real, quantifiable productivity gains.


