Steps Ahead
Buy vs build: analysing the cost gap of data solutions in 3 steps
Banks must consider carefully and make an informed decision – but the business impact of not acting at all is too big to ignore.
By John Showell, COO of Mosaic Smart Data
One of the most difficult decisions for an organisation considering a new software solution is whether it should build the solution using in-house IT resources or buy market-ready products.
Surprisingly, many of these decisions have historically been based on emotion. Decision-makers choose what ‘feels right,’ or rely on past experiences working with unrelated vendors on a different requirement. Ideally, decisions would be based on the key criteria of cost, efficiency and productivity, delivered through the lens of specialised capital markets expertise.
With complex requirements, even defining the process to arrive at a decision can seem daunting. However, when hard data is available, making an emotional decision is simply not good business practice. Nowhere is this challenge more pronounced than when a bank attempts to tackle its data pains. The business implications of being able to harness data more effectively are clear. This is what decision makers care about.
How can a bank start to calculate the cost gap between building a data analytics solution and buying a ready-made solution, in order to make an informed decision?
Step 1 – Calculating Build Cost
Build Effort
To estimate the internal build cost of an equivalent solution, we need to estimate the effort required. We can begin by analysing the effort required to build the existing Mosaic FICC data analytics product. To arrive at the estimates below we have broken down the Mosaic MSX platform into logical functions and then catalogued the effort in designing and building each part.
Total effort expended in designing and building the platform is over 96 person-years of effort. Of this, 1/3 of the effort (32 FTE) was spent on components that have subsequently been retired, technology choices that were later abandoned, and models that failed in validation and did not make it into production.
The remaining 2/3 of the effort (64 FTE) was spent on components, models and technology choices that form the current production product. It is likely that any platform built independently would follow a similar learning curve, with multiple iterations before a final, stable solution is available. We therefore believe that Mosaic’s total expended effort of 96.5 FTE is a fair representation of the minimum effort it would require for an equivalent solution to be designed and built independently.
Resource Costs
To calculate the cost of developing an equivalent platform independently, we need to factor in the technology resource costs that banks face. Given the skills sets required (machine learning and quant finance) it is more likely that suitable resources would be available in onshore, and therefore high-cost locations. We would also recommend onshore design and development given the necessary interaction with intended users (front office). However, for completeness we have also provided example costs for offshore, low-cost locations.
Fully loaded technology resource costs for onshore, high-cost locations in the investment banking industry typically range from $225k to $275k per year; whilst offshore, low-cost locations range from $50k to $100k per year.
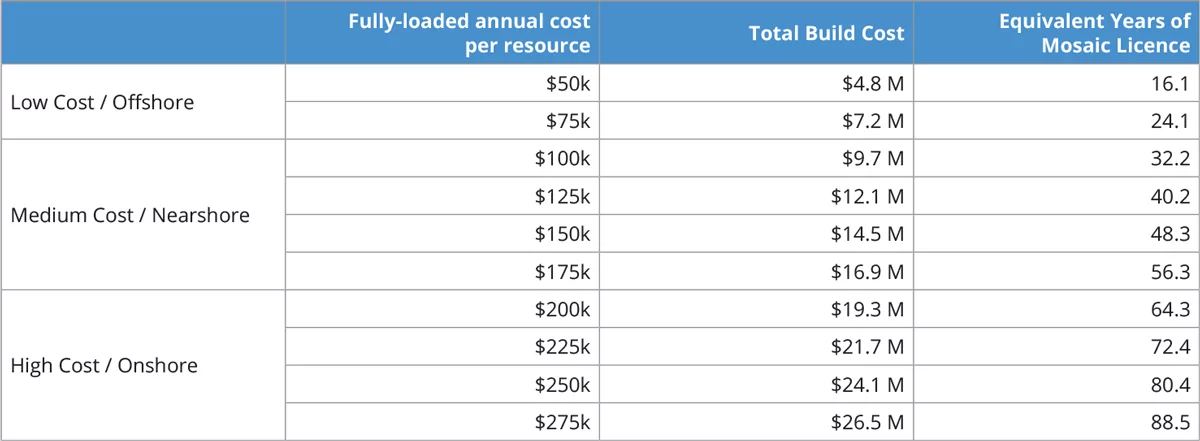
The table below shows the total build cost for a range of resources costs, assuming the earlier effort estimate of 96.5 person-years of effort. For comparison, the final column shows how many years you could licence Mosaic for the same cost (assumes an hosted licence for a two asset classes or two regions).
As an example, if your fully loaded technology resources costs are $250k/year it would take an investment of over $24.1 million to launch an equivalent data analytics solution. For the same cost, you could license Mosaic for 80.4 years (assuming an enterprise license for a single asset class).
Step 2 – Calculating Time to market
Another important consideration is the length of time it would take to build an equivalent solution, since the project will only begin to deliver value towards the end of the build. The time-to-market is dependent upon the size of the team working on the build.
A larger team can build a solution more quickly, since the overall effort is divided by the number of resources. However, there are limits to how well this scales in reality. Larger teams are harder to organize, and shorter timeframes make it more difficult to get feedback and iterate on solutions.
Step 3 – Calculating On-Going Operational Costs
The model calculations above do not take into account the on-going costs of maintaining a solution once it is built.
Support and maintenance
Once the solution is complete, resources will still be required for regular support and maintenance. For example: fixing bugs, applying mandatory patches, updating third party dependencies, and changing product taxonomy mappings. The requirement will vary with number of users, asset classes and frequency of use but could be up to 3 FTEs.
In contrast, maintenance updates and level 3 support are included with the Mosaic licence fee.
Product Development
The projected build effort has assumed matching a snapshot of the current Mosaic functionality. In practice Mosaic’s functionality continues to evolve rapidly. Building a true equivalent would require sustained investment to keep pace with Mosaic’s future product roadmap.
Mosaic has a team of more than 50 engineers, data scientists and client services analysts focused on improving and developing the product, with more customer value delivered in each release.
Third Party Licences
An equivalent solution is likely to rely on third party technologies that incur their own licence fees. For example, a time series database (e.g. $100k/y for KDB), and a visualization tool (e.g. $50k/y for Tableau).
In contrast, all costs for the software Mosaic relies upon are covered in the Mosaic licence fee (hardware costs associated with hosting are charged separately).
Total Cost of Ownership
These additional operating costs that are associated with running an equivalent in-house solution have a significant impact on total cost of ownership.
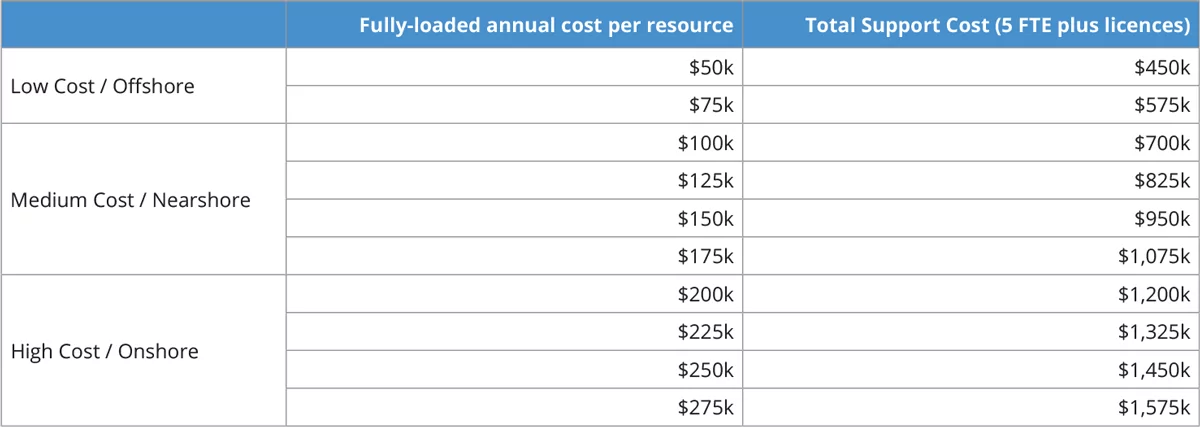
As before, the actual cost varies significantly depending upon the cost of the resources used. For illustration, suppose that 5 FTEs were dedicated to support and ongoing development, and there were associated technology licencing costs of $200k per year: the annual support costs and third-party license fees might vary from $450k offshore up to $1.5M onshore. In all cases these would comfortably exceed the cost of a Mosaic licence fee.
How confident can we be that buying is more cost effective than an internal build?
J.P. Morgan’s independent analysis concluded that a similar solution would cost three times as much to develop and run internally.
Other Mosaic customers have reached similar conclusions when looking at cost and time-to-market to build internally.
One global investment bank reported spending $4.5 – $5 million annually over multiple years to build a solution which achieved a sub-set of the features offered by Mosaic.
Conclusion
If your objective is to attain a market leading solution, once factoring in on-going costs, there is simply no time horizon over which building an equivalent solution in-house achieves a lower total cost of ownership.
Mosaic offers an award-winning solution, designed specifically for capital markets, by a team with deep domain expertise and experience. The product is already built and in daily use by leading investment banks. Mosaic is ready to be deployed rapidly for you and will deliver immediate business value.


